by Cassady Palmer • @crpalmer0627 • Mar 7
The Good:
- Batting Average. After hitting just .200 against Memphis and .137 versus Tennessee, the Hoosiers began to turn their bats around last week with a batting average of .269. That average went up to .299 when looking at just the weekend. This is more along the lines of what we expected coming out of Fall Ball.
- Pitching with Runners in Scoring Position. The Indiana pitching staff largely pitched better last week with runners in scoring position than they did without (the big exception being the next bullet point). The opponent batting average with RISP was just .125 compared to .211 without runners, and only one of those hits went for extra bases. They also struck out 26% of the batters they faced with RISP, compared to 20% without.
The Bad:
- Free Passes. As we saw in the Coastal Carolina game, free passes can easily come back to bite a team. On the week, the Indiana staff either walked or plunked 29 batters. Seven of those runners would go on to score and another two advanced a runner who would then score (on something other than a home run). That’s almost 30% of free passes leading directly or indirectly to a run. The silver lining to this is that four of those eight impactful free passes were in that one game against Coastal Carolina and could quite possibly be a fluke.
The Ugly:
- Errors. Like the free passes, errors can pretty quickly turn right around and hurt a team. During the five games last week, the Hoosier fielders committed 10 errors. While that’s not end-of-the-world terrible, the impact those errors could have on the game sort of were. Six of the 10 errors lead to a score of some kind, with seven of the 20 runs given up during the week being unearned. This was particularly critical against Coastal Carolina, where the Hoosiers gave up a pair of unearned runs and lost by just one run. It also could have been important versus UConn, there Indiana won by three but gave up three unearned runs.
Interesting Tidbit:
- The Hoosier batters drew a lot more walks last week compared with the first two weekends. Against Memphis and Tennessee Indiana walked in only 5% of plate appearances. Last week the Hoosiers drew the walk in 14% of plate appearances. Past seasons have shown that over the long run this will probably even out to about a 9-10% walk rate.
Key Numbers to Watch:
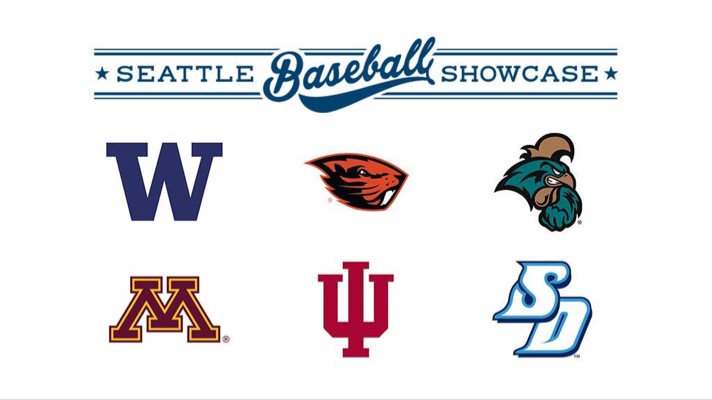
- Strikeouts. If the Hoosiers can prove this weekend that the strikeout numbers from last week were not a fluke, I will remove this from the key numbers to watch. The definition of high strikeout, however, will be a little more flexible, as the level of competition in Seattle will be pretty high. The Washington staff is averaging almost 11 Ks per game, Oregon State is averaging 9 Ks per game, and San Diego is at 10 Ks per game. The Hoosier offense, in comparison, is at almost 12 Ks per game. If Indiana can fall below the 30-strikeout mark for the weekend, I will be pretty impressed.
- Stolen bases. Swiping bags could be an area of contention all weekend. The Hoosiers are moderately aggressive on the base paths, but are successful more likely than not, having stolen 11 bases in 14 attempts. None of the teams this weekend have given up many stolen bases, but they also haven’t been tested too often. Only two runners have successfully stolen a base against Washington in six tries. San Diego opponents have had slightly better luck at four stolen bases in nine tries. But the leader of the pack is Oregon State, where only four runners have attempted to steal a base and only one of them was successful. As much as I preach that opponents would be wise to not run on Ryan Fineman, the Hoosiers would be wise to minimize the testing of Adley Rutschman’s arm.
- Extra-base Hits. On the season, the Hoosiers have smashed 41% of their hits for extra bases; this includes 19% of their hits going out of the ballpark. Their opponents, on the other hand, don’t give up many extra-base hits. Washington comes in at the lowest of the weekend a just 23% of their hits. San Diego is a close second at 26% of their hits, and Oregon State is not far off at 31%. Home runs have also been at a premium against these teams, as they have only given up a combined 13 homers in 34 games.
- T-Mobile Park. To make matters in the previous bullet point even more difficult, the newly-renamed T-Mobile Park was among the most pitcher-friendly in the MLB in 2018. Using the Park Factor statistic through ESPN, T-Mobile park was the 2nd most difficult park in which to collect hits and doubles, 4th most difficult to score runs, and 16th most difficult to hit home runs. Combining this with the tough opponent pitching staff could potentially be rough for the Hoosiers. Or we could get something more like what Sam Travis did to this baseball at Target Field in 2013.