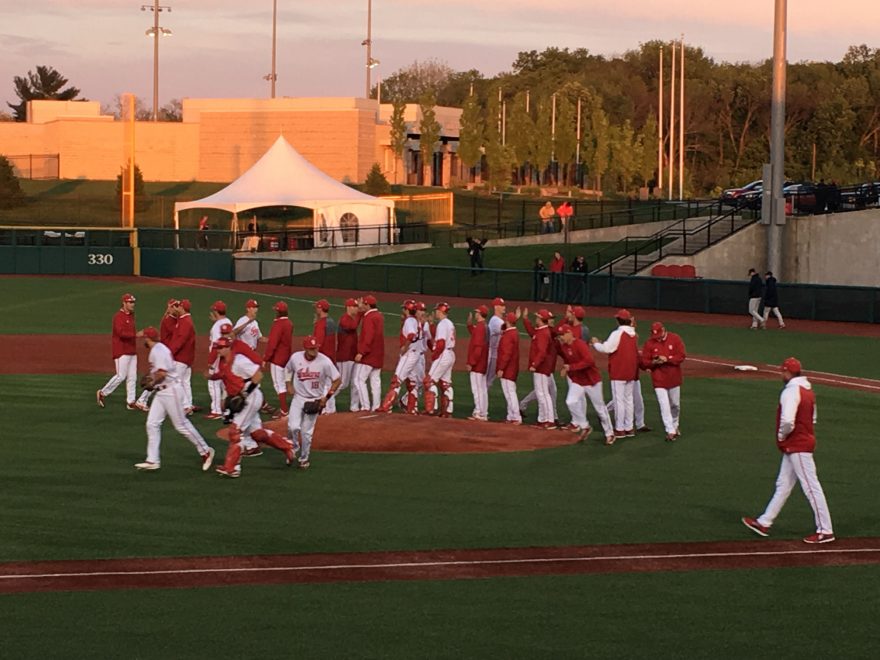
According to Warren Nolan’s excellent RPI site (http://warrennolan.com/baseball/2018/schedule/Indiana) and now the official NCAA site (https://www.ncaa.com/rankings/baseball/d1/rpi) the Hoosiers are #2 in the nation in RPI. I’ve seen some excitement on Twitter about that. It is a testament to what the Hoosiers have done so far, but I write this to tamp down the excitement just a bit.
The RPI formula is 50% opponent win percentage, 25% team win percentage (adjusted for win-loss), and 25% opponent’s opponents win percentage. In my opinion RPI is a better metric in baseball than it is in basketball (which it was invented for), but not this early in the season.
By the end of the year, the bulk of every teams record is comprised of roughly a dozen 3-game series (about two-thirds of the schedule). This is telling because a better team should take 2 out of three. A much better team should sweep such a series. In basketball, the bulk of the schedule is single game match-ups and a decent team may lose all of its tough games just like a bad team would. In baseball the decent team probably gets 1 out of 3 in those series while the bad team gets swept. The win-loss record is likely more meaningful. There are also just more games in total which provides for a better sample size.
I discuss this point because the first 3 weeks of the season have a lot of anomalies to them. There are a lot of the multiple team “tournaments” where teams play different competition every day. This was the case for the Hoosiers in the first two weeks. Teams from the midwest and northeast have not played any home games yet. RPI counts a road win as 1.3, a home win as 0.7 and vice-versa for losses. The reason the NCAA adjusts that much is to encourage teams like the top SEC and ACC teams that could conceivably play all of their non-conference games at home to occasionally go on the road. In reality baseball’s home/away impact in win percentage would be closer 1.1/0.9 if based on statistical advantage. There is a home field advantage, but nothing like basketball (which has a 1.4/0.6 in RPI because of how different home and away performance is).
In the 3 weeks this year, Indiana has played 2 of its toughest already. Many (but not all) of the top teams in the country have played an easy home schedule so far. Now IU has a 10 game home stretch of mostly weak competition. The opener against Cincy and the last game of the home stand against Wright State are exceptions to that. The 8 in the middle will significantly depress the Hoosier’s strength of schedule. And as half of the schedule to date on March 21st, the real-time RPI (especially if there are any loses in the mix) could be much lower than it is now.
No need to panic. The Hoosiers have a strong conference schedule and a strong slate of mid-week games throughout April and May. The RPI only means anything on selection Monday in May and the Hoosiers are set-up well provided that they keep winning. This 10 game home stand needs to be dominant for the Hoosiers. I’m looking for at least a 9-1 performance. If they falter, it’s not a disaster, but they will need to make up for with tougher wins and maybe a couple of series sweeps in conference (I have 0 conference sweeps in my model as of now).
In a few weeks I will spend most of this column discussing my predictive RPI look for where the Hoosier’s will likely finish the season. The targets are a top-16 finish for hosting a regional and a top-40 finish for getting an at-large bid. I will also be looking at conference standings more and how the unbalanced B1G Ten schedule will be impacting the fight for a B1G Ten regular season title and seeding the conference tournament.

