By Cassady Palmer • @crpalmer0627 • March 21st
Over the offseason I decided to undertake a bigger numbers project: put together a win probability model for Indiana baseball. I worked on it some during the Big Ten Tourney last season, researching some base formulas and applying them. And it wasn’t half bad.
So I read more in the offseason, although I’ll preface this by saying that I’m not a mathematician, am actually nowhere near that. But I’m alright with numbers and excel spreadsheets and research and figured I’d give it a shot.
I went back to 2012 and applied a few different versions of a formula to see what was the most successful, at least as far as Big Ten play was concerned. And at absolute worst from 2012-2018, every model was a bit better than flipping a coin and were correct between 55-60% of the time. But at their best they were correct at least three out of every four games.
Now, these models are based on the team win/loss records, including the home/away records and the game of the series (first game, second game, or third game) records. Win/loss record is generally considered to be the most accurate predictor of future games, with a caveat: there has to be a balanced schedule (every team plays every other team). This is not the case for the Big Ten, and there’s not really an ideal way to get around it, at least not at my level of math.
The workaround solution I came up with to minimize the schedule disparities was to just add more numbers. As a general rule, increasing the sample size (in this case the number of games played) increases the accuracy of the data. This should work particularly well for minimizing the schedule differences because (hopefully) the conference strength of schedule is somewhat random, meaning that a team is not overly likely to have consecutive very tough or very light schedules. But, this also means that early in the year the predictions are based predominantly on the previous season of play. Most of the time this is alright, as teams tend to stay roughly consistent from one year to the next, rarely making big jumps up or down in quality. Those rare times, well… they aren’t often predictable anyway so it’s not that big of a concern.
So… where does that leave us for this year? As I’m still trying to work out kinks in both my model and process (it is still not as automated as I would like), I’m sticking to the Big Ten schedule. I may eventually be able to work it up to all weekend series and maybe the midweeks as well. For now, Big Ten win probability is where we’re at.
Now, my initial predictions:
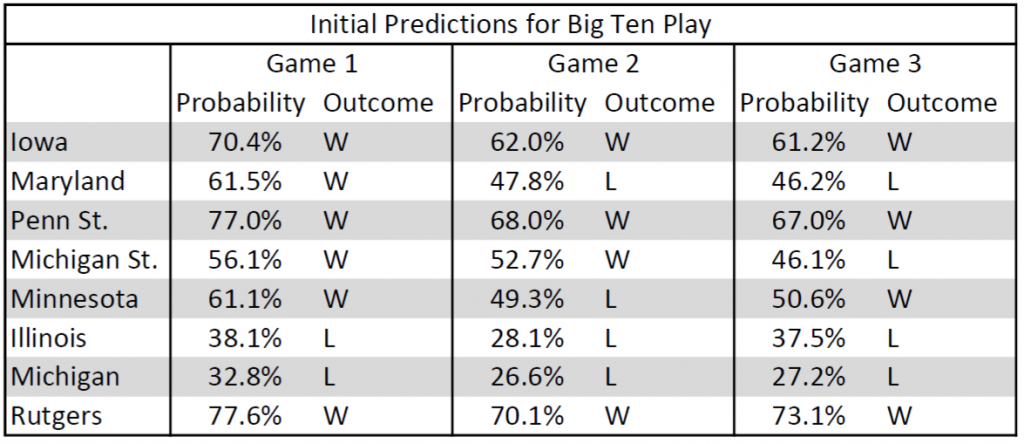
I currently have the Hoosiers going 14-10 in Big Ten play, but it’s still early. And there are a good few “toss-up” games, where the probability is within 5 percentage points of 50%. In the worst case scenario, where all of those within the 50-55% range are actually losses, the Hoosiers would go 12-12. In the best case scenario, where all of those within the 45-50% range are actually wins, Indiana would be 18-6 in the conference.
But remember that these are probabilities. A 30% win probability means that IU does in fact win the game 3 times out of 10. And without fail there will be at least one game with something weird that is outside the range of normal and can impact the game in unpredictable ways. Just a small list of examples: a weather delay forces an ace starter out of a game early, an unscheduled doubleheader leads to an unplanned tweak to the lineup, or (my personal favorite from the 2015 season) the 8th-best fielding team in the country (Notre Dame) commits 5 errors including 2 in the 9th inning.
So take these predictions with a grain of salt, and we’ll see how they do in this first test run of a season. I will update the predictions each week of Big Ten play, so there may (probably will) be changes to the outcome predictions as we go.
And if this doesn’t work, well, I gave it a shot and had a good time looking into it.